Pages

Friday, January 28, 2011

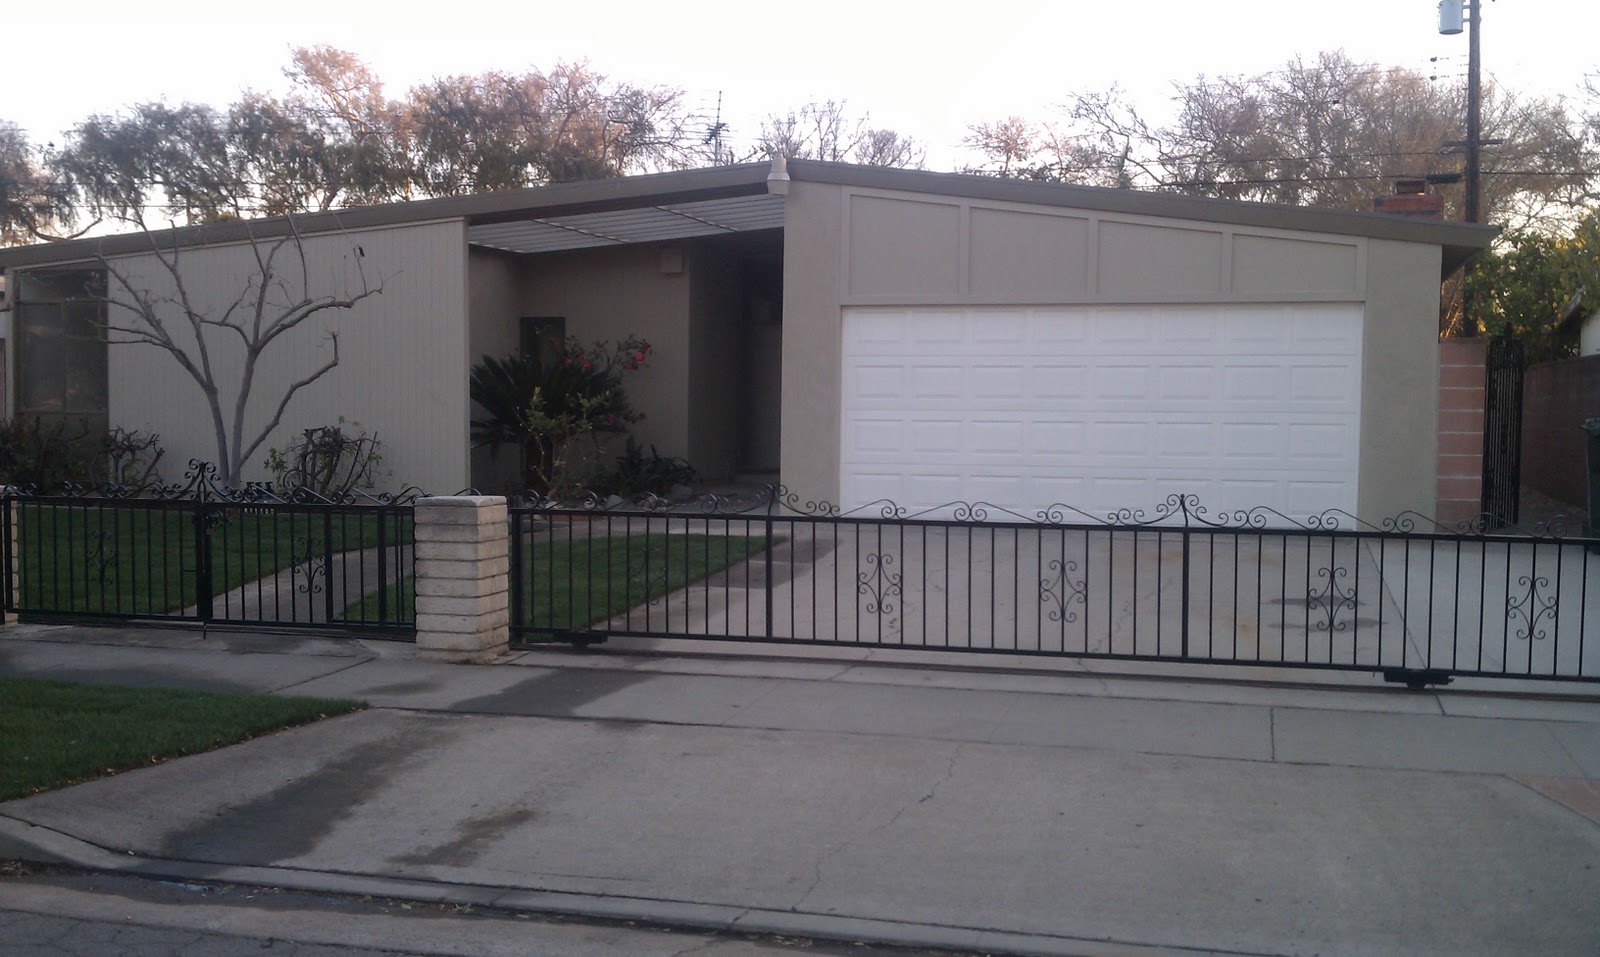
624 W. West Ave Fullerton 92832 - Leased!

Leased!  Avail again 4/1/12. 3 bedroom 2 bath home with open floor plan and vaulted ceilings. House is on quiet tree lined street in city of Fullerton. Fullerton is near the cities of Anaheim, Brea, Placentia, La Habra, Orange, and Garden Grove. Home features nearly 1300 sqft of living space, 2 car garage, private laundry, vaulted ceilings, wood burning fireplace, large yard with new sod, some new appliances, new paint, and an enclosed patio. Owner will consider some pets, tenant pays utilities, $30 screening fee for all applicants (18+), security deposit will be equal to one months rent.


Mid Century Fullerton Home with Large Yard
3 Bedrooms
2 Bathrooms
2 Car Garage
1279 sqft Living Space
Vaulted Ceilings
Quiet Street
Wood Burning Fireplace
Large Yard
Enclosed Patio


$1,895/mo


Security Deposit = 1 Months rent
Will Consider Pets
Tenant Pays Utilities


624 W. West Ave
Fullerton CA 92832


Tuesday, January 18, 2011

Housing Market Report 2011 - Irvine, CA

If you need 13,000 sqft in Irvine, only $18 million separates you :)
This thing is crazy, click here to take the tour
 Irvine is a unique real estate market in that it has a very large amount of mid-level homes, quite a few upscale areas, and another very large amount of entry-level townhomes and condos. We can tell you first hand that these entry level units in areas like Woodbridge, North Park, Woodbury, etc were very popular with the first time buyers in 2010. Because of the number of sales in this lower price points (where the avg price per sq ft is normally higher) the stats might be a little higher per square foot than what actually happened.


Overall, it was a very volatile year for Irvine real estate but one that actually ended up very close to where it started. The coming 2011 we expect to be a continuation of the late 2010 market and what most would term as a buyers market.


Inventory vs Average Days on the Market

The end of the tax credit era (tax credits to home buyers) came to an end early summer of 2010. Leading up the this, the city of Irvine, along with many other areas of Orange County saw a market revival out of the 2008 and 2009 doldrums. Inventories increased while time on the market decreased; meaning that houses were selling and homeowners were listing them in order to take advantage. With the end of the era, the inventory levels have been decreasing while the average days on the market continues to climb. To us, this means that the market has taken a turn back towards a very buyer friendly state.


Sales Volume

The graph below will also show the dramatic affect of the tax credits on home buyers. The most Irvine home sales were made in late spring as the deadline approached, ultimately climaxing in 800 homes sold in May. Since this time, the sales numbers for homes in Irvine have come down to about under 500 by years end. In essence, the number of home sales dropped, increased, and then decreased by about 38% all within the same year. 
Number of sold homes in Irvine

Average Price Per Sqft

The average cost per square foot for a home in Irvine has also come down a bit in 2010.  During the peak season of the year we averaged $351 per square foot and are now down around $330; meaning your average 1800 sqft home in Irvine has been selling for just under $600,000. 
 
Irvine average price per square foot

One unique component of Irvine's real estate market has to do with the overall affluence level. While Irvine has definitely seen its share of foreclosures and short sales, the average homeowner would still not be deemed as "distressed". Because of this, when the market slows, the majority choose not to sell and are not in the category we'd call "have to sells." This is evidenced by inventories coming down (people taking homes off market/choosing not to sell) while time on the markets simultaneously goes up (fewer buyers).

What all this tells us is much like the rest of the County, Irvine experienced a slower market in '08-09, had a nice bump in 2010, and has again leveled off to a buyers market. We expect to see more of this in 2011, making it a great year for buyers to get some good deals (although they may not have as many options as they are accustomed to) and sellers had better be real motivated in order to sell their Irvine homes.

Wednesday, December 29, 2010

Housing Market Report 2010 - Newport Beach, CA

Really Cool Newport House $31,750,000
click here to see slideshow
While Newport Beach saw cooler Spring/Summer temperatures than most are accustomed to, the hot time to sell in 2010 was definitely during these months. There are normally more homes on the market during the warm seasons, but it will sometimes just mean more competition among sellers. Interestingly enough, the other sales statistics were also up in favor of the sellers (when compared with the rest of the year).  The best time to buy a home in Newport Beach, CA might just be these last months of the year with prices more reflective of the beginning of 2010 but with more inventory to choose from.


Sales Volume

After a brutal Winter season, Newport's home sales rebounded strongly through the Spring and Summer seasons.  After the peak of roughly 75 homes selling each month, Newport Beach's volume has slightly slowed to roughly 70 homes per month. (Note: The sales stats below are indicative of the combined sales volume for the previous three months.)


Number of sold homes in Newport Beach


Avg Days on Market vs Inventory

With the Spring pickup in sales activity, word spread among homeowners that things were starting to sell again. What we then saw was a 30% increase in inventory! In other words, more options for buyers but more competition for those toying with the idea of selling. The last quarter of the year has seen inventory levels drop off slightly which is pretty typical for the coastal market in the cooler months.

Also of interesting note, the Average Days on the Market for Newport Beach homes was very high at the beginning of 2010, taking nearly 9 months on the average to sell. This came down with the upswing in sales activity to an average of about 6 months to sell. Since then, we've noticed the average starting to get longer and the graph below will show what we mean.


Average Price Per Square Foot

This statistic is always a tricky one because it can really fluctuate based on what size homes are selling. If its larger homes, the avg can actually go down, and vice-versa with smaller homes. Still, what we have seen is a spike in the average during the hot selling season Newport had in the Spring. Since then, it has dropped quite a ways down from over $900 per square foot to almost $700 per square foot. This can be a big deal if all other things are equal. For example, take your average 2,000 square foot home, it is $1,800,000 at $900/sqf and only $1,400,000 at $700/sqf. This is definitely a trend buyers are hoping will continue down and homeowners want to see climb back up.


Newport Beach average price per square foot

We're always open to questions and encourage comments.

Monday, December 27, 2010

Housing Market Report 2010 - Fullerton CA

Downtown Neighborhood Review - Fullerton, CAWith the end of the year, we thought it'd be a good time to post updates on the home sales market so people can start planning for 2011. We picked the 5 cities in our service area that are typically the best indicators for the overall health of the market: (Fullerton, Irvine, Newport Beach, Long Beach, Whittier). This will be a 5 part series, here is part 1 of 5 "Fullerton, CA" In the new year, these type of statistics will be available monthly on our website.

The Summary

2010 had a few periods of exceptional market health. In particular, the spring period leading up to the end of the tax credits actually had very good number of homes sold in Fullerton. Since then, the market has softened and we are seeing an increase in numbers of days on the market while simultaneous seeing a drop in number of homes on the market. To us, this means pricing is staying low not from a large number of home options, but from an overall lack of buyer interest. For these reasons, we'll probably see the continuation of the current buyers market over the next few months.

Inventory vs Avg Days on the Market

Inventory (# of homes on the market) peaked in September, but has been decreasing to approx 450 homes on market. This is still quite a few homes on the market and usually indicates a buyers market in Fullerton.

Average Days on Market is coming up as well from the August low of 120 days on market. Now were heading past 150 days and climbing.


Median Home Price

The median price was lowest over the summer at $530,000 and is not much changed since that time. Don't worry though entry level home buyers, this is a little misleading, there are still many Fullerton homes available in the $300,000 to $400,000 price range.


Sales Volume

The graph below depicts sales from previous 3 months at any given date. Sales peaked in at about July meaning the best months were April, May, and June with approximately 146 homes being sold each month. Sales volumes have been decreasing since this time to the approx 100 homes per month current level. In a nutshell we're selling 25-35% of the available inventory every month...and yes that's pretty indicative of a buyers market.

Number of sold homes in Fullerton

These are all just averages and approximates. If you have specific questions, please don't hesitate to contact us.
Friday, December 10, 2010

Gov Talks of Eliminating Mortgage Interest Deduction

This is a huge deal to current homeowners and anybody who will need a loan in order to ever buy a home. For roughly 100 years, Americans have been able to receive tax deductions for the interest charged on their home loans as a measure to reward the middle class and encourage the American dream. Now, some members of our government are proposing an end to that!


The Federal Deficit Commission has incorporated the elimination of the Mortgage Interest Deduction into a few of their proposals to reduce the deficit. While most of us can recognize that the deficit is a big issue, almost nobody who owns, or plans to own, a home will like this proposal. While I really don't feel it will ever get off the ground, we really need to nip this in the bud early as the potential damage to the housing markets and overall economy are overwhelming.


I really hate "talking points" and I wish I had an easier way of calling into our Senators, but for now, this National Association of Realtors Call to Action should work for you. It worked for me. Please excuse the "talking points" guy and just say whatever you feel, even if its just "I want the MID, I thought that was one of the reasons to buy a house?"  or "How about you congress folk waive your deduction and leave us alone"  link is below   


-Todd

http://www.realtoractioncenter.com/realtor-party/click-to-call-mid-senate.html  


http://www.realtoractioncenter.com/realtor-party/click-to-call-mid-senate.html


Monday, November 1, 2010

Fed's Home Loan For Fixer Uppers - FHA 203(k)

Many home buyers have heard of the FHA loan program; however, most are not aware of a secondary loan specificially designed for all home buyers who want to purchase "fixers" and need a loan for the purchase and the rehabilitation. This loan, known as HUD's FHA 203(k) is a great program and one that buyers who aren't afraid of taking on a fixer should seriously consider.


Here is a summary of the program:

- FHA 203(k) is a program that provides loans for the purchase and renovation of fixer properties.
- The program allows for downpayments of as low as 3.5%.
- "Fixers" can range from simply dated to uninhabitable.
- Eligible properties can be between one and four units.
- Can be used to convert single family homes to two-, three , or four units if legal.
- Can apply to demolished homes provided some of foundation remains.


Here's the limitations:

-Investors can't utilize this program.
-Property will need to appraise under market value before the repairs and at market after the repairs.
-"Luxury" upgrades aren't covered but many modernizations like roofs, heating, paint, flooring are considered completely acceptable.
-Buyers must use HUD approved appraiser, lender, and repair contractors.
-Property must be in FHA approved project if property is a condo or has an HOA.
-Interest rates typically run 1% higher than conventional loans and have a little higher closing cost.

Here is our thoughts on who this will benefit:

Overall, the FHA 203(k) program is an amazing program and one that can offer consumers a chance to build equity in a home, beautify a neighborhood, get in with a low downpayment, and obtain a very cheap rehabilitation loan for the repairs. There are many guidelines that buyers will need to be familiar with if they would like to utilize this program. Still, the rules are fairly clear and easy to follow and we think this loan program is just another great gadget in the home buyers toolbelt.


Saturday, October 16, 2010

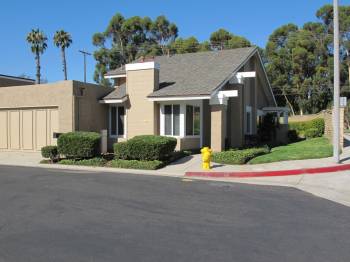
2331 Huron Circle, Placentia CA 92870 - Home For Lease

Single Story 3 Bedroom, 2 Bath Spacious Attached Home with Laundry and Garage! This Beautiful patio home in the Woodfield community of Placentia, CA has been upgraded and includes Granite Counters, Tile Floors, Fresh Paint and New Fixtures. Convenient features include Laundry Hookups (Gas or Electric), Fireplace, Enclosed Patio, 2 car garage with direct access, master bedroom with on suite upgraded bath, gas stove, vaulted ceilings in living area, and private atrium. Placentia CA is near the cities of La Habra, Fullerton, Brea, Yorba Linda, Diamond Bar, and Anaheim. Woodfield community is right across the street from Tri-City Park and a short drive from major shopping centers, Brea Mall, and freeway access. Tenant pays all utilities. Pets would be considered but owner would prefer no pets.

Rent - $1999
Security Deposit - $1999
Pet Deposit - $400
2331 Huron Circle
Placentia CA 92870
Home For Lease